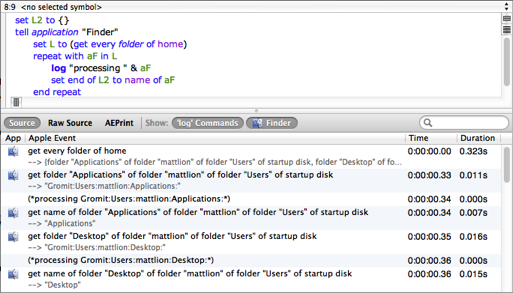
The event log lists the communications that pass between your script and target applications — Apple events and their results. You can also use it to hold messages sent by your script with the AppleScript log command.
The event log preserves the results of all Apple events performed during the execution of a script, and lets you explore those results. Thus it operates as a basic debugger, because, very often, what you said to an application and (especially) what answer that application gave is exactly what you want to know about your script.
By default, the event log is shown as a pane of the script window — the event log pane. To display the event log pane:
-
Choose View > Show Event Log.
-
Or, click Show Event Log in the script window toolbar.

Instead of the event log pane, you may prefer to see the log in a separate window.
WARNING: If the log is showing while your script runs, your script may run slower (because of the overhead of displaying the log’s contents in real time). If speed (or accurate timing) is of the essence, close the log display before you execute your script and open it afterwards.
Scope Bar
At the top of the event log is a scope bar. You can show or hide the scope bar:
- Control-click in the event log and choose Show/Hide Scope Bar from the contextual menu.
Columns
The event log has two columns:
-
The event list. This column is always displayed. It lists each Apple event, shown as an AppleScript command and accompanied by its result, along with its time and duration.
Events can be listed in three “languages”:
-
Source (AppleScript). Choose View > Log As Source, or click Source in the scope bar.
-
Raw (four-letter codes). Choose View > Log As Raw (Chevron) Syntax, or click Raw Source in the scope bar.
-
AEPrint (the actual Apple event content). Choose View > Log As AEPrint, or click AEPrint in the scope bar.
Events can also be filtered, using buttons in the scope bar. Choices are:
-
'log'Commands. Messages sent by the script by callinglog. -
By Application. All applications with which an Apple event message was exchanged are listed. If an application isn’t highlighted, its Apple events are not displayed in the log.
If
'log'Commands is not highlighted and no application is highlighted either, the event log will be empty!To turn off filtering conveniently so that all events are shown, choose Show All Events from the contextual menu.
-
-
The log result explorer. This column is an explorer showing the result of the event selected in the event list. To display the log result explorer:
-
Choose View > Show Log Result Explorer.
-
Or, Control-click in the first column and choose Show Log Result Explorer from the contextual menu.
-

An alternate way to see an explorer for an Apple event result, without the overhead of showing two columns in the event log simultaneously, is to double-click the event in the event list. This opens a separate explorer window on the result.
Miscellaneous
You can copy an Apple event from the log. This is the message sent by your script to a scriptable application. To do so:
-
Select a line in the event list, and choose File > Copy.
-
Or, Control-click and choose Copy Event from the contextual menu.
-
Or, drag-and-drop a line of the event list into a text environment.
You can copy a result of an Apple event from the log. This is the reply returned by a scriptable application to your script. To do so:
- Control-click and choose Copy Event Result from the contextual menu.
During debugging, a correspondence is maintained between each Apple event and the line of the script where it was performed. To highlight the corresponding script line:
- Select a line in the event list.
By default, events remain in the log until the next execution of the script — that is, the default policy is to clear the log when execution begins. You can modify this policy. To clear the log immediately:
- Choose Script > Clear Event Log.
Just the opposite, to prevent the log from being cleared when the next execution begins:
- Choose Script > Append To Event Log (so that it is checked).
|
||||