An explorer can be generated as a separate window — an explorer window. For example:
-
The result associated with script window can appear as a separate explorer window.
-
You can set an Execution preference so that this happens automatically (“Show result when scripts pause or end” > “Show Result Explorer Window”).
-
Or, choose Script > Show Result Explorer Window.
-
Or, Control-click in the grey bar at the top of the result pane and choose Show Result Explorer Window from the contextual menu.
-
-
The result of an Apple event recorded in the event log can appear as a separate explorer window.
-
Double-click an event in the log to open its result as an explorer window.
-
Or, choose Script > Show Result Explorer Window.
-
Or, Control-click the event and choose Show Event Log Result Explorer.
-
-
A value within the outliner of any explorer can appear as a separate explorer window. This includes an outliner in an explorer window! Thus, it’s possible to generate a series, or cascade, of explorer windows.
-
Control-click the value and choose Open Explorer Window from the contextual menu.
-
Or, select the value and choose File > Open Explorer Window.
In a partial explorer, you can alternatively double-click the value. (In a full-fledged explorer, double-clicking a value hoists it.)
-
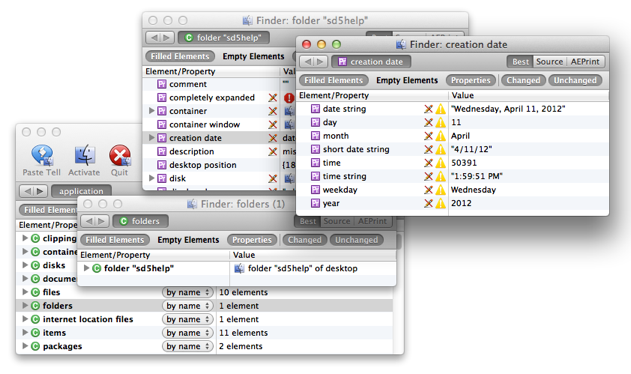
A separate explorer window, or a cascade of separate explorer windows, can be a way to focus more easily on the information that interests you. This is demonstrated in the illustration below, which shows three explorer windows spawned successively from a dictionary explorer: folders within the application explorer > folders as a separate list window > folder "sd5help" > creation date of folder "sd5help".

NOTE: An explorer window has a toolbar, but the toolbars are hidden in the above screen shot, to save space.
An explorer window maintains its linkage back to the explorer from which it was spawned. This linkage expresses the full identity of the value being explored. To see an explorer window’s identity:
-
Control-click the explorer window’s title.
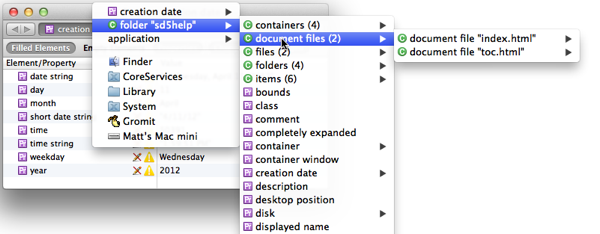
A pop-up menu appears. Each successive item in the menu is a step up the object model, as if there were an implicit
ofbetween them. For example, in the illustration below, the explorer window is showing thecreation date of folder "sdhelp5"(of the application “Finder”).Moreover, each menu item itself has a hierarchical menu exploring the entire object model of that object! This is exactly parallel to the hierarchical menu attached to the Paste Tell menu item.

An explorer window remains “live”: it changes if the value being explored changes, provided Script Debugger “knows” about the change. For example, an explorer window spawned off from a script window’s result pane or variables pane may change its value spontaneously, because Script Debugger “knows” when these values need to be refreshed (e.g., you ran the script again). In other cases, you might need to ask Script Debugger to reload an explorer: choose Dictionary > Reload.
An explorer window may also close spontaneously if the value being explored ceases to exist. For instance, an explorer window that is exploring a variable from the variables pane will close when the variable goes out of scope. Similarly, an explorer window that is exploring an element of a class will close if that class is refreshed and the element no longer exists.
To set defaults for the size, view, and display options of explorer windows:
- Summon an explorer window, set its size and display options as desired, and choose Window > Set Default Explorer Size & State.