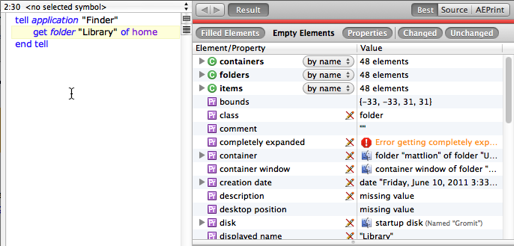
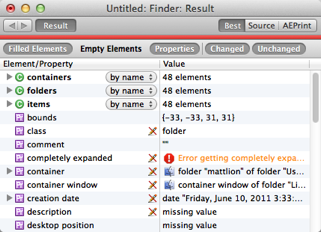
Viewing the result of a script is often a primary reason for running the script; viewing the result of a particular line of a script is often a primary reason for debugging the script. Script Debugger provides several ways to view a result:
-
The result pane. This is part of the script window. It is an explorer, which means you have the power to see the result value using different views, including Best view, which will be an interactive outliner if the value is an object or collection.
To see the result pane:
-
Choose View > Result & Variables Tab.
-
Or, click Result & Variables in the toolbar.
-

-
The result explorer window. This shows the result in exactly the same way as the result pane; the difference is that it’s a separate window, not part of the script window. This can be a good choice if (for example) you want to save space within the script window, or if you want to keep viewing the result while switching the script window’s tabs to see something else (such as the Inspectors tab).
To see the result explorer window, choose Script > Show Result Explorer Window (or choose Show Result Explorer Window from the contextual menu that appears when you Control-click on the grey area at the top of the result pane).

-
The result bar. It’s just a bar (at the top of the text area), so all there’s room for is the result in Source view. But that’s the point: this is the most space-saving way to view the result.
To see the result bar, choose View > Show Result Bar. To dismiss the result bar, choose View > Hide Result Bar or click the “x” in the result bar.

In the Mini Debugger, the result bar is always present and is the only way to see the result (without switching back to Script Debugger).
NOTE: If the result has changed since the previous execution of the script, the result pane and result explorer window will display a red bar at the top, and the result bar will display the word “Result:” in red. This is particularly useful in debug mode, where an individual line of code might or might not generate a changed result. (After you run a script all the way through in normal mode, if there’s a result, it is always new, so the red indicator will appear by default.)
Although you can always manually see the result in any of those ways, the result is so important that Script Debugger would like to show it to you automatically every time there’s a result. An Execution preference, “Show result when scripts pause or end”, determines which way the result is displayed automatically:
-
No. No attempt is made to display the result automatically; if it isn’t showing already, you’ll have to summon it manually if you want to see it.
-
Show Result Inspector. It’s as if you’d chosen View > Result & Variable Tab. This can be abrupt if you were looking at a different tab, but it has the advantage of being an excellent view of the result right in the script window, plus you are also shown such addition information as variable values (and, when debugging, the call stack).
-
Show Result Bar. The result bar is shown, as if you’d chosen View > Show Result Bar.
-
Show Result Explorer Window. A separate explorer window is opened, as if you’d chosen Script > Show Result Explorer Window.
NOTE: This preference is meaningful only if the result is not already showing. If the result is already showing — for example, the result bar or the result pane is visible — then the new result is simply displayed there, as if this preference were set to No.