
|
The Mini Debugger |
|
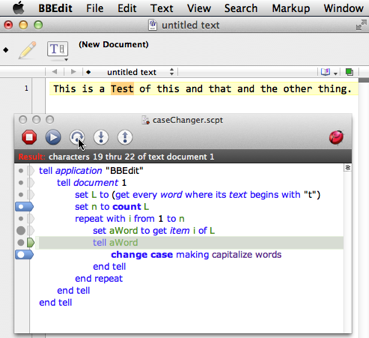
The Mini Debugger is a floating window that puts Script Debugger’s frontmost script window in front of all applications on your screen.
Most AppleScript code involves targeting scriptable applications (and some AppleScript code is called by other applications, as with external debugging). Thus it is often convenient to have some control over Script Debugger while keeping some other application frontmost, so that you can control or observe that application, without changing the layering order among your applications. That’s what the Mini Debugger lets you do.
To summon the Mini Debugger:
-
Choose Window > Mini Debugger.
-
If you’re in another application, choose Mini Debugger from Script Debugger’s Dock menu.
The Mini Debugger window contains:
-
A reduced version of the script window toolbar.
Buttons include Stop, Execute/Resume, and the three Step buttons (active only when the script is debug mode).
There is also a Script Debugger toolbar button; click it to bring Script Debugger frontmost.
-
A non-editable text area. Don’t try to edit the script in the Mini Debugger! The Mini Debugger isn’t the key window, and keystrokes will fall through to the frontmost application. The text area contextual menu does work, however.
-
The gutter. You can set breakpoints and see code coverage.
-
The result bar. This gives the latest result at each pause, in source view.